
Key SaaS Metrics That Actually Matter in 2026

Modest Mitkus
October 1, 2026
If you're building a SaaS product or any subscription-based digital offering, you're probably swimming in data. Page views, signups, clicks, sessions - the list goes on. But here's the thing: most of those numbers won't actually tell you whether your business is healthy or headed for trouble. Understanding key saas metrics is what separates founders who scale successfully from those who burn through cash wondering what went wrong. Whether you're launching your first app or growing an established product, knowing which metrics to watch (and which to ignore) can make all the difference.
The Foundation: Monthly Recurring Revenue
Let's start with the big one. Monthly Recurring Revenue (MRR) is the heartbeat of any subscription business. It's the predictable revenue you can count on each month from your subscribers.
Why MRR Matters More Than Total Revenue
MRR gives you a crystal-clear picture of your business trajectory. Unlike one-time sales that spike and dip unpredictably, MRR shows you the baseline income you're generating month after month. This predictability is gold when you're planning product development, hiring, or just trying to sleep at night.
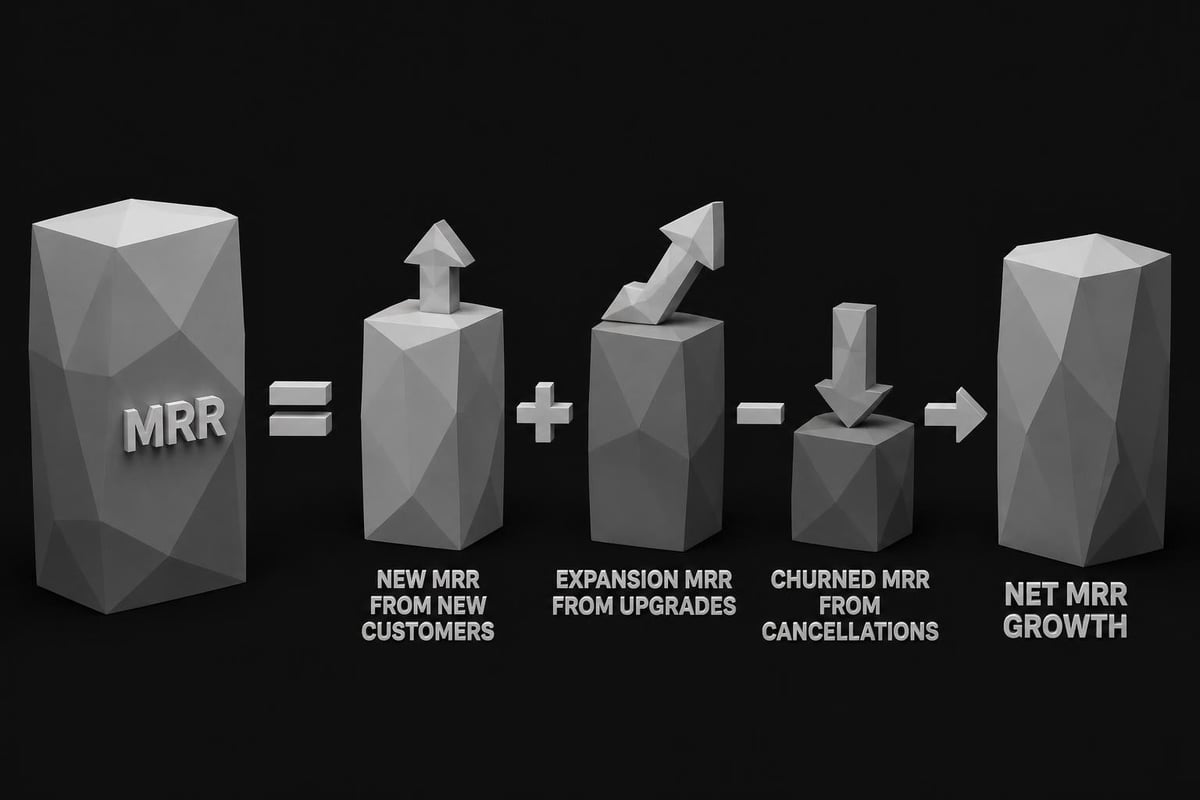
There are actually several flavors of MRR you should track:
- New MRR: Revenue from brand new customers
- Expansion MRR: Additional revenue from existing customers upgrading
- Churned MRR: Revenue lost from cancellations
- Contraction MRR: Revenue lost from downgrades
- Net New MRR: The sum of it all (new + expansion - churned - contraction)
The detailed breakdown of MRR calculations helps you understand not just how much revenue you're generating, but where it's coming from. That context is everything.
ARR: The Bigger Picture
Annual Recurring Revenue (ARR) is simply MRR times twelve, but it's what investors and stakeholders want to see. When you're looking at yearly contracts or planning long-term strategy, ARR gives you the macro view. For smaller products or early-stage launches, stick with MRR - it's more responsive to changes and easier to track week-to-week.
Customer Acquisition Cost: What You're Really Spending
Customer Acquisition Cost (CAC) tells you how much you're spending to land each new customer. It's one of those key saas metrics that sounds simple but requires honest accounting.
To calculate CAC, add up all your sales and marketing expenses for a period, then divide by the number of customers you acquired in that same period. Simple math, but here's where people mess up: they forget to include everything. Salaries, software tools, ad spend, content creation costs, that conference booth you rented - it all counts.
| Expense Category | What to Include |
|---|---|
| Marketing | Ads, content, SEO tools, agencies, software subscriptions |
| Sales | Salaries, commissions, CRM tools, outreach software |
| Overhead | Portion of general expenses allocated to acquisition |
Here's what makes CAC tricky: the number alone doesn't tell you if it's good or bad. Spending $500 to acquire a customer might be brilliant or disastrous depending on what that customer is worth to you over time.
Customer Lifetime Value: The Long Game
Customer Lifetime Value (LTV or CLV) estimates the total revenue you'll generate from a customer over their entire relationship with your product. This is where things get interesting, because LTV and CAC work together to tell you if your business model actually works.
The basic formula: Average revenue per user per month × customer lifespan in months. But calculating lifespan requires knowing your churn rate, which we'll get to in a minute.
The golden rule: Your LTV should be at least 3x your CAC. This ratio tells you if you're spending money efficiently to acquire customers. If your LTV:CAC ratio is below 3:1, you're probably spending too much on acquisition or not generating enough value from customers. Above 5:1? You might be under-investing in growth.
Understanding the relationship between LTV and CAC is crucial for building a sustainable SaaS business that can actually scale profitably.
Churn Rate: The Silent Killer
Churn rate measures the percentage of customers who cancel their subscriptions in a given period. It's probably the most important of all key saas metrics because high churn can destroy even the fastest-growing business.
Two Types of Churn to Track
Customer churn is the percentage of customers who leave. Calculate it by dividing customers lost during a period by customers at the start of that period.
Revenue churn (or MRR churn) shows the percentage of recurring revenue lost. This is often more telling because losing a high-value customer hurts more than losing someone on your cheapest plan.
- Monthly churn rate of 5% means you're losing half your customers every year
- Even 2-3% monthly churn compounds into significant customer loss
- Best-in-class SaaS companies keep churn below 5% annually
Here's the kicker: reducing churn by just 1% can have a massive impact on your bottom line over time. Small improvements compound.

Net Revenue Retention: The Growth Multiplier
Net Revenue Retention (NRR) tells you if you're growing revenue from your existing customer base, even accounting for churn. It's calculated by taking your starting MRR, adding expansion revenue, subtracting churned and contraction revenue, then dividing by starting MRR.
An NRR above 100% means magic is happening. You're generating more revenue from existing customers through upgrades and expansions than you're losing to churn. This is the holy grail because it means your product creates so much value that customers naturally expand their usage over time.
Companies with NRR above 120% can grow significantly even without acquiring new customers. That's the power of building something people can't live without.
CAC Payback Period: Time to Profitability
How long does it take to recover the money you spent acquiring a customer? That's your CAC payback period, and it's critical for cash flow planning.
Calculate it by dividing your CAC by the monthly recurring revenue per customer. If you spend $600 to acquire a customer who pays $50/month, your payback period is 12 months.
Why this matters: The faster you recover CAC, the more efficiently you can reinvest in growth. Most healthy SaaS businesses aim for a payback period under 12 months. Anything over 18 months starts getting dangerous unless you have deep pockets.
Growth Rate: Momentum Metrics
Your month-over-month and year-over-year growth rates show how fast you're scaling. For MRR growth, calculate the percentage increase from one period to the next.
Early-stage products should be growing 10-20% month-over-month if they've found product-market fit. As you scale, growth rates naturally slow, but you should still see steady increases.
Don't get hung up on vanity metrics here. A 50% growth rate sounds impressive, but if you're growing from $100 to $150 MRR, it's not meaningful yet. Context matters.
Activation Rate and Time-to-Value
These key saas metrics measure how quickly new users get value from your product. Activation rate is the percentage of signups who complete a key action that indicates they're actually using your product (not just tire-kickers).
Your activation milestones might include:
- Completing onboarding
- Creating their first project
- Inviting team members
- Publishing their first output
- Returning for a second session
Time-to-value measures how long it takes users to reach that "aha moment" where they see real value. The faster you can get users to experience value, the better your retention will be.
If you're building digital products, shortening time-to-value should be a top priority. Build and Launch Your SaaS App in 14 Days teaches you how to create products that deliver value quickly, which is exactly what keeps users from churning in those critical first days.

Expansion Revenue: Growing What You've Got
Expansion revenue comes from existing customers increasing their spending through upgrades, add-ons, or additional seats. This is often cheaper than acquiring new customers and signals strong product-market fit.
Track expansion MRR as a percentage of your total MRR. If 20% of your monthly revenue growth comes from expansion, you're building something sticky that creates increasing value over time.
| Expansion Strategy | How It Works | Best For |
|---|---|---|
| Seat-based pricing | Customers add team members | Collaboration tools |
| Usage-based tiers | Pay more as usage grows | API services, analytics |
| Feature upgrades | Unlock advanced capabilities | Productivity apps |
| Add-on modules | Purchase additional features | All-in-one platforms |
Quick Ratio: The Health Check
The Quick Ratio is a simple but powerful metric for SaaS health. It's calculated by dividing your growth (new + expansion MRR) by your churn (churned + contraction MRR).
A Quick Ratio of 4 means you're growing four times faster than you're shrinking. That's healthy momentum. Below 2 and you should be concerned. Below 1 and you're in trouble - you're shrinking, not growing.
Choosing Your North Star Metric
With all these key saas metrics, you might wonder which one to focus on. Enter the North Star Metric concept - the one number that best captures the core value your product delivers.

Your North Star should be a leading indicator of revenue that reflects real customer value. For a project management tool, it might be "projects completed per week." For a creator platform, "products published." For a subscription app, it could be "active daily users."
The key is connecting your North Star to long-term success. It should be something that, if it goes up, almost certainly means your business is getting healthier.
Cohort Analysis: Time-Based Insights
Cohort analysis groups customers by when they signed up and tracks their behavior over time. This reveals patterns that aggregate metrics miss.
You might discover that customers who signed up in Q1 have 40% better retention than Q3 signups. Why? Maybe your onboarding improved, or maybe Q1 customers came from a better traffic source. This insight lets you double down on what's working.
Track cohorts by:
- Signup month
- Acquisition channel
- Initial plan tier
- Geographic region
- Customer segment
The patterns you find will guide everything from marketing spend to product development priorities.
Benchmarking Your Metrics
Knowing your numbers is step one. Understanding if they're good is step two. Industry benchmarks from leading SaaS investors give you context for your performance.
Here are some rough benchmarks for healthy SaaS businesses:
- Gross churn: Under 2% monthly (under 20% annually)
- Net revenue retention: 100%+ (120%+ is exceptional)
- LTV:CAC ratio: 3:1 to 5:1
- CAC payback: Under 12 months
- Quick Ratio: 4 or higher
Remember these are guidelines, not absolutes. Early-stage products will look different than mature ones. B2B typically has better retention but higher CAC than B2C. Context always matters.
Putting It All Together: Your Metrics Dashboard
You don't need to track every possible metric. Focus on the ones that matter for your stage and business model.
For early stage (pre-product-market fit):
- Activation rate
- User engagement metrics
- Qualitative feedback
- Early retention signals
For growth stage (scaling up):
- MRR growth rate
- CAC and LTV
- Churn rate
- NRR
- Quick Ratio
For mature stage (optimizing):
- All of the above
- Cohort retention curves
- Expansion revenue
- Sales efficiency
- Unit economics by segment
Set up a simple dashboard that you actually check weekly. Spreadsheets work fine. Fancy analytics tools are nice but not necessary. The point is having visibility into trends, not real-time data overload.
The Metrics That Matter for Digital Product Creators
If you're building apps, tools, or other digital products as a solo founder or small team, your priorities shift slightly. You need to be even more focused because you don't have resources to waste.
Prioritize these key saas metrics:
- Time-to-value - Get users to their first win fast
- Monthly churn - Keep it under 5% or your growth won't compound
- CAC - Keep acquisition costs lean (organic, content, community)
- Activation rate - Make onboarding seamless
- Expansion potential - Build pricing that grows with usage
The beautiful thing about digital products is the potential for incredible unit economics. Low marginal costs mean even modest MRR can be highly profitable if you control CAC and churn.
Understanding and tracking key saas metrics transforms your digital product from a guessing game into a growth engine you can actually steer. The numbers tell you what's working, what's broken, and where to focus your limited time and resources. Ready to stop trading hours for dollars and build products that generate revenue while you sleep? CreateSell provides the courses and resources you need to build, launch, and scale digital products that actually sell - no coding experience required.